
Greater access to data is changing how we view the world. Being able to understand and interpret often complex data helps us to understand more about the context in which we live.
Charts and maps of all types now communicate data in services such as our online banking, fitness tracking apps, and in news stories. Encountering these visual representations of data means that data visualisation literacy is becoming a key skill, which helps us to form accurate insights. In a research context, data visualisation plays an important role in making our research findings accessible and engaging.
It allows us to communicate complex data and ideas to researchers from both within and outside of our disciplines, as well as to policy makers and to the wider public. By incorporating interactivity in such visualisations, which allows users to direct their own explorations by filtering, searching and manipulating the data in different ways, we enable users to engage with our research at a deeper level by asking their own questions of our data.
Data Visualisation in AHSS Research
Using such approaches enables researchers to explore data-driven projects in many Arts, Humanities & Social Sciences (AHSS) disciplines which, in the past, may not have easily embraced such methods, such as in Classics, English, Film Studies, Gaeilge and History. At the recently launched Moore Institute Digital Lab, we work with researchers from these disciplines and across the arts and humanities, to design and create interactive data visualisations that add value and engagement to research projects.
The major European Research Council-funded Readers and Reputations: The Reception and Circulation of Early Modern Women’s Writing, 1550-1700 (RECIRC) project, led by Prof. Marie-Louise Coolahan, used a variety of data visualisations throughout the project’s development – in the construction of its online database, and in its exhibition, hosted in the Hardiman Building’s exhibition space.

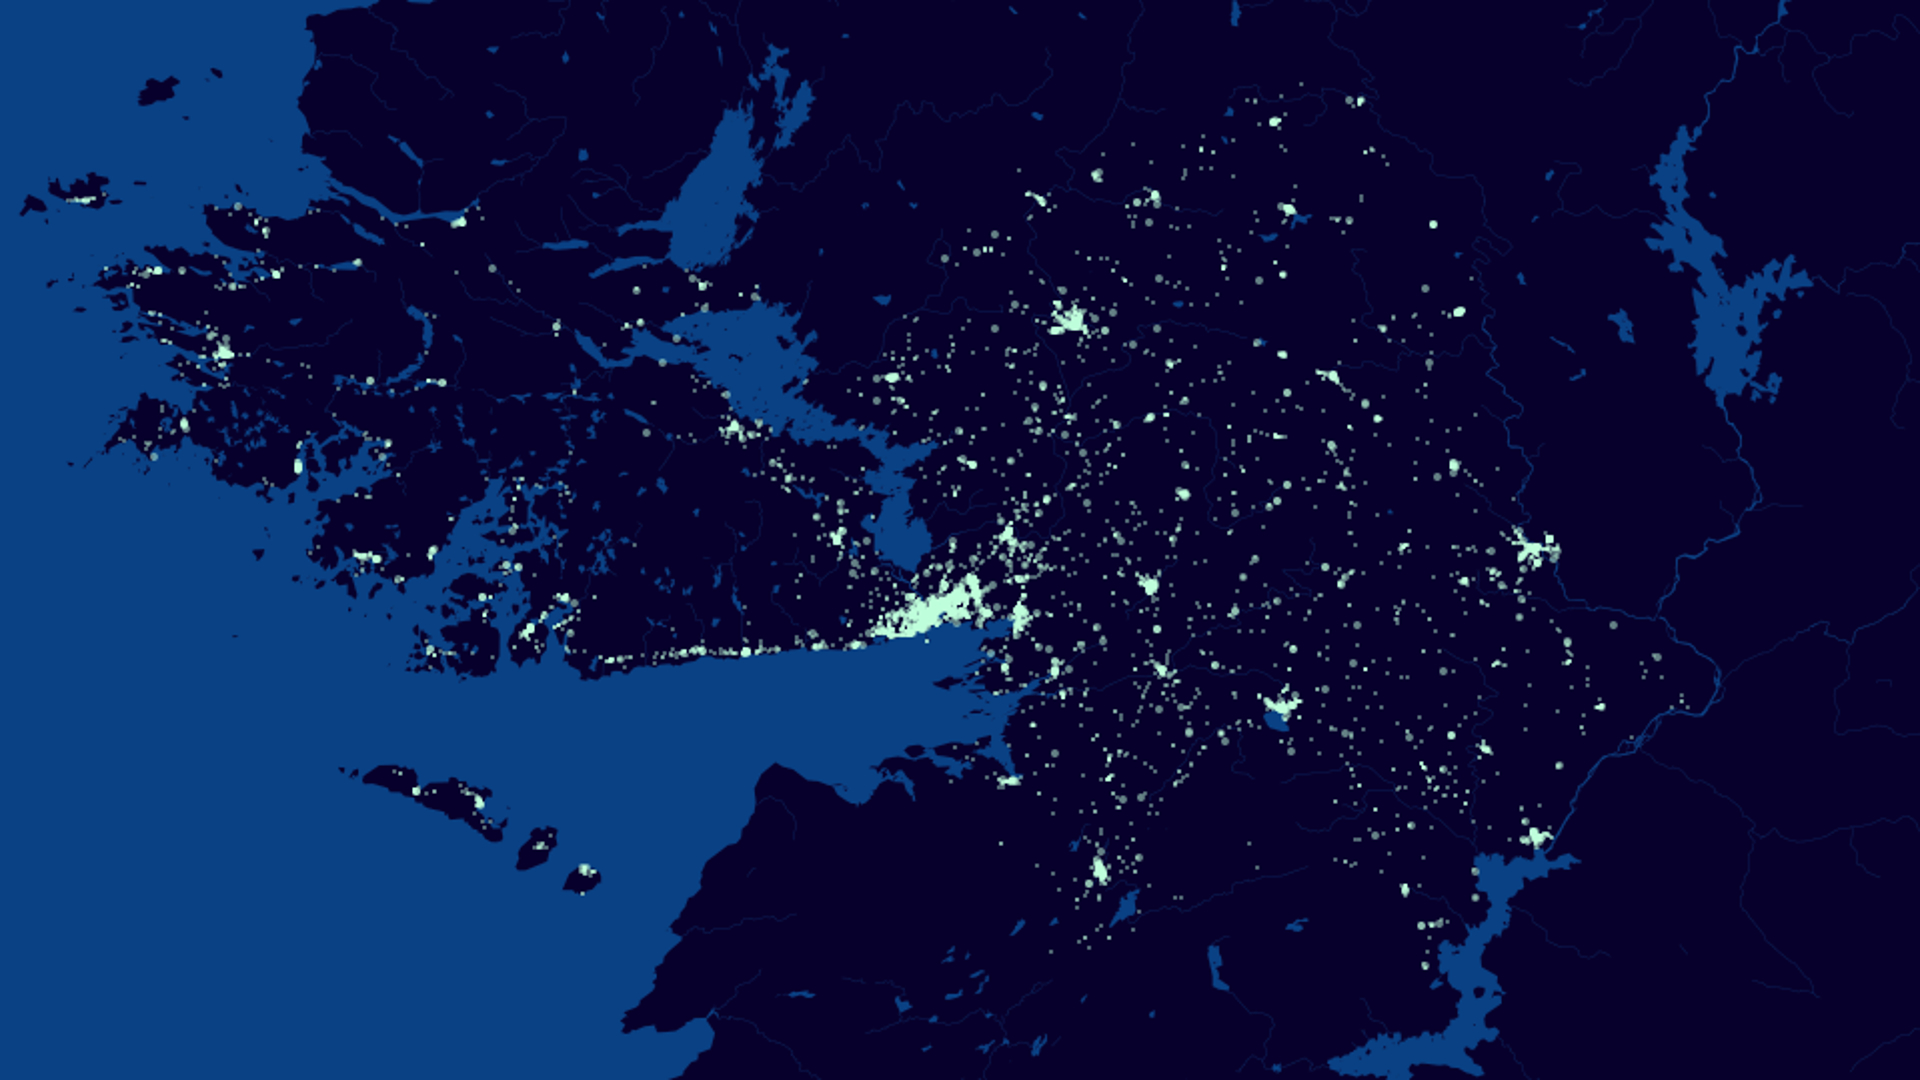
Speaking about the role of data visualisation in the project, Prof. Coolahan said, “The RECIRC project was aiming to gather a large amount of evidence about the ways in which women’s writing was read and circulated in the sixteenth and seventeenth centuries. Ultimately, we found almost 5,000 different receptions of female authors and their works. But we needed to understand their connectedness – patterns in the kinds of reception, the kinds of people reading. Data visualisation techniques were invaluable in parsing the evidence so that we could see the relationships of readers and forms of reading, as well as the social networks between different readers and authors. They brought together evidence that might otherwise have seemed disparate, and allowed us as a team to identify and analyse the big picture of what was going on. We released all our evidence as an open-access database, searchable in multiple different ways, hosted by the Moore Institute, in January 2020. This has been a great success in bringing our research to international scholars, many of whom use the RECIRC database regularly for their own research”.
One form of visualisation created by the project can be seen in the animation above, which shows the connections discovered between women writers and those who read their works, with special attention being drawn to significant figures in the period.
The Irish Research Council Laureate project, Republic of Conscience, led by Prof Rióna Ni Fhrighil, examines Irish poets’ literary responses to international human rights crises and violations from 1914 to the present. The project is currently exploring approaches to interactive visualisation which will give users of the web resource opportunities to engage with a collection of poetry which spans over 100 years. Users will view and explore the entire collection, or filter it by particular themes or world events, depending on their interests. Doing so will enable users to see patterns in the collection which may otherwise be missed, and to consider questions they may not otherwise identify.

Personæ: A Character-Visualisation Tool for Dramatic Texts, David Kelly, Justin Tonra & Lindsay Ann Reid
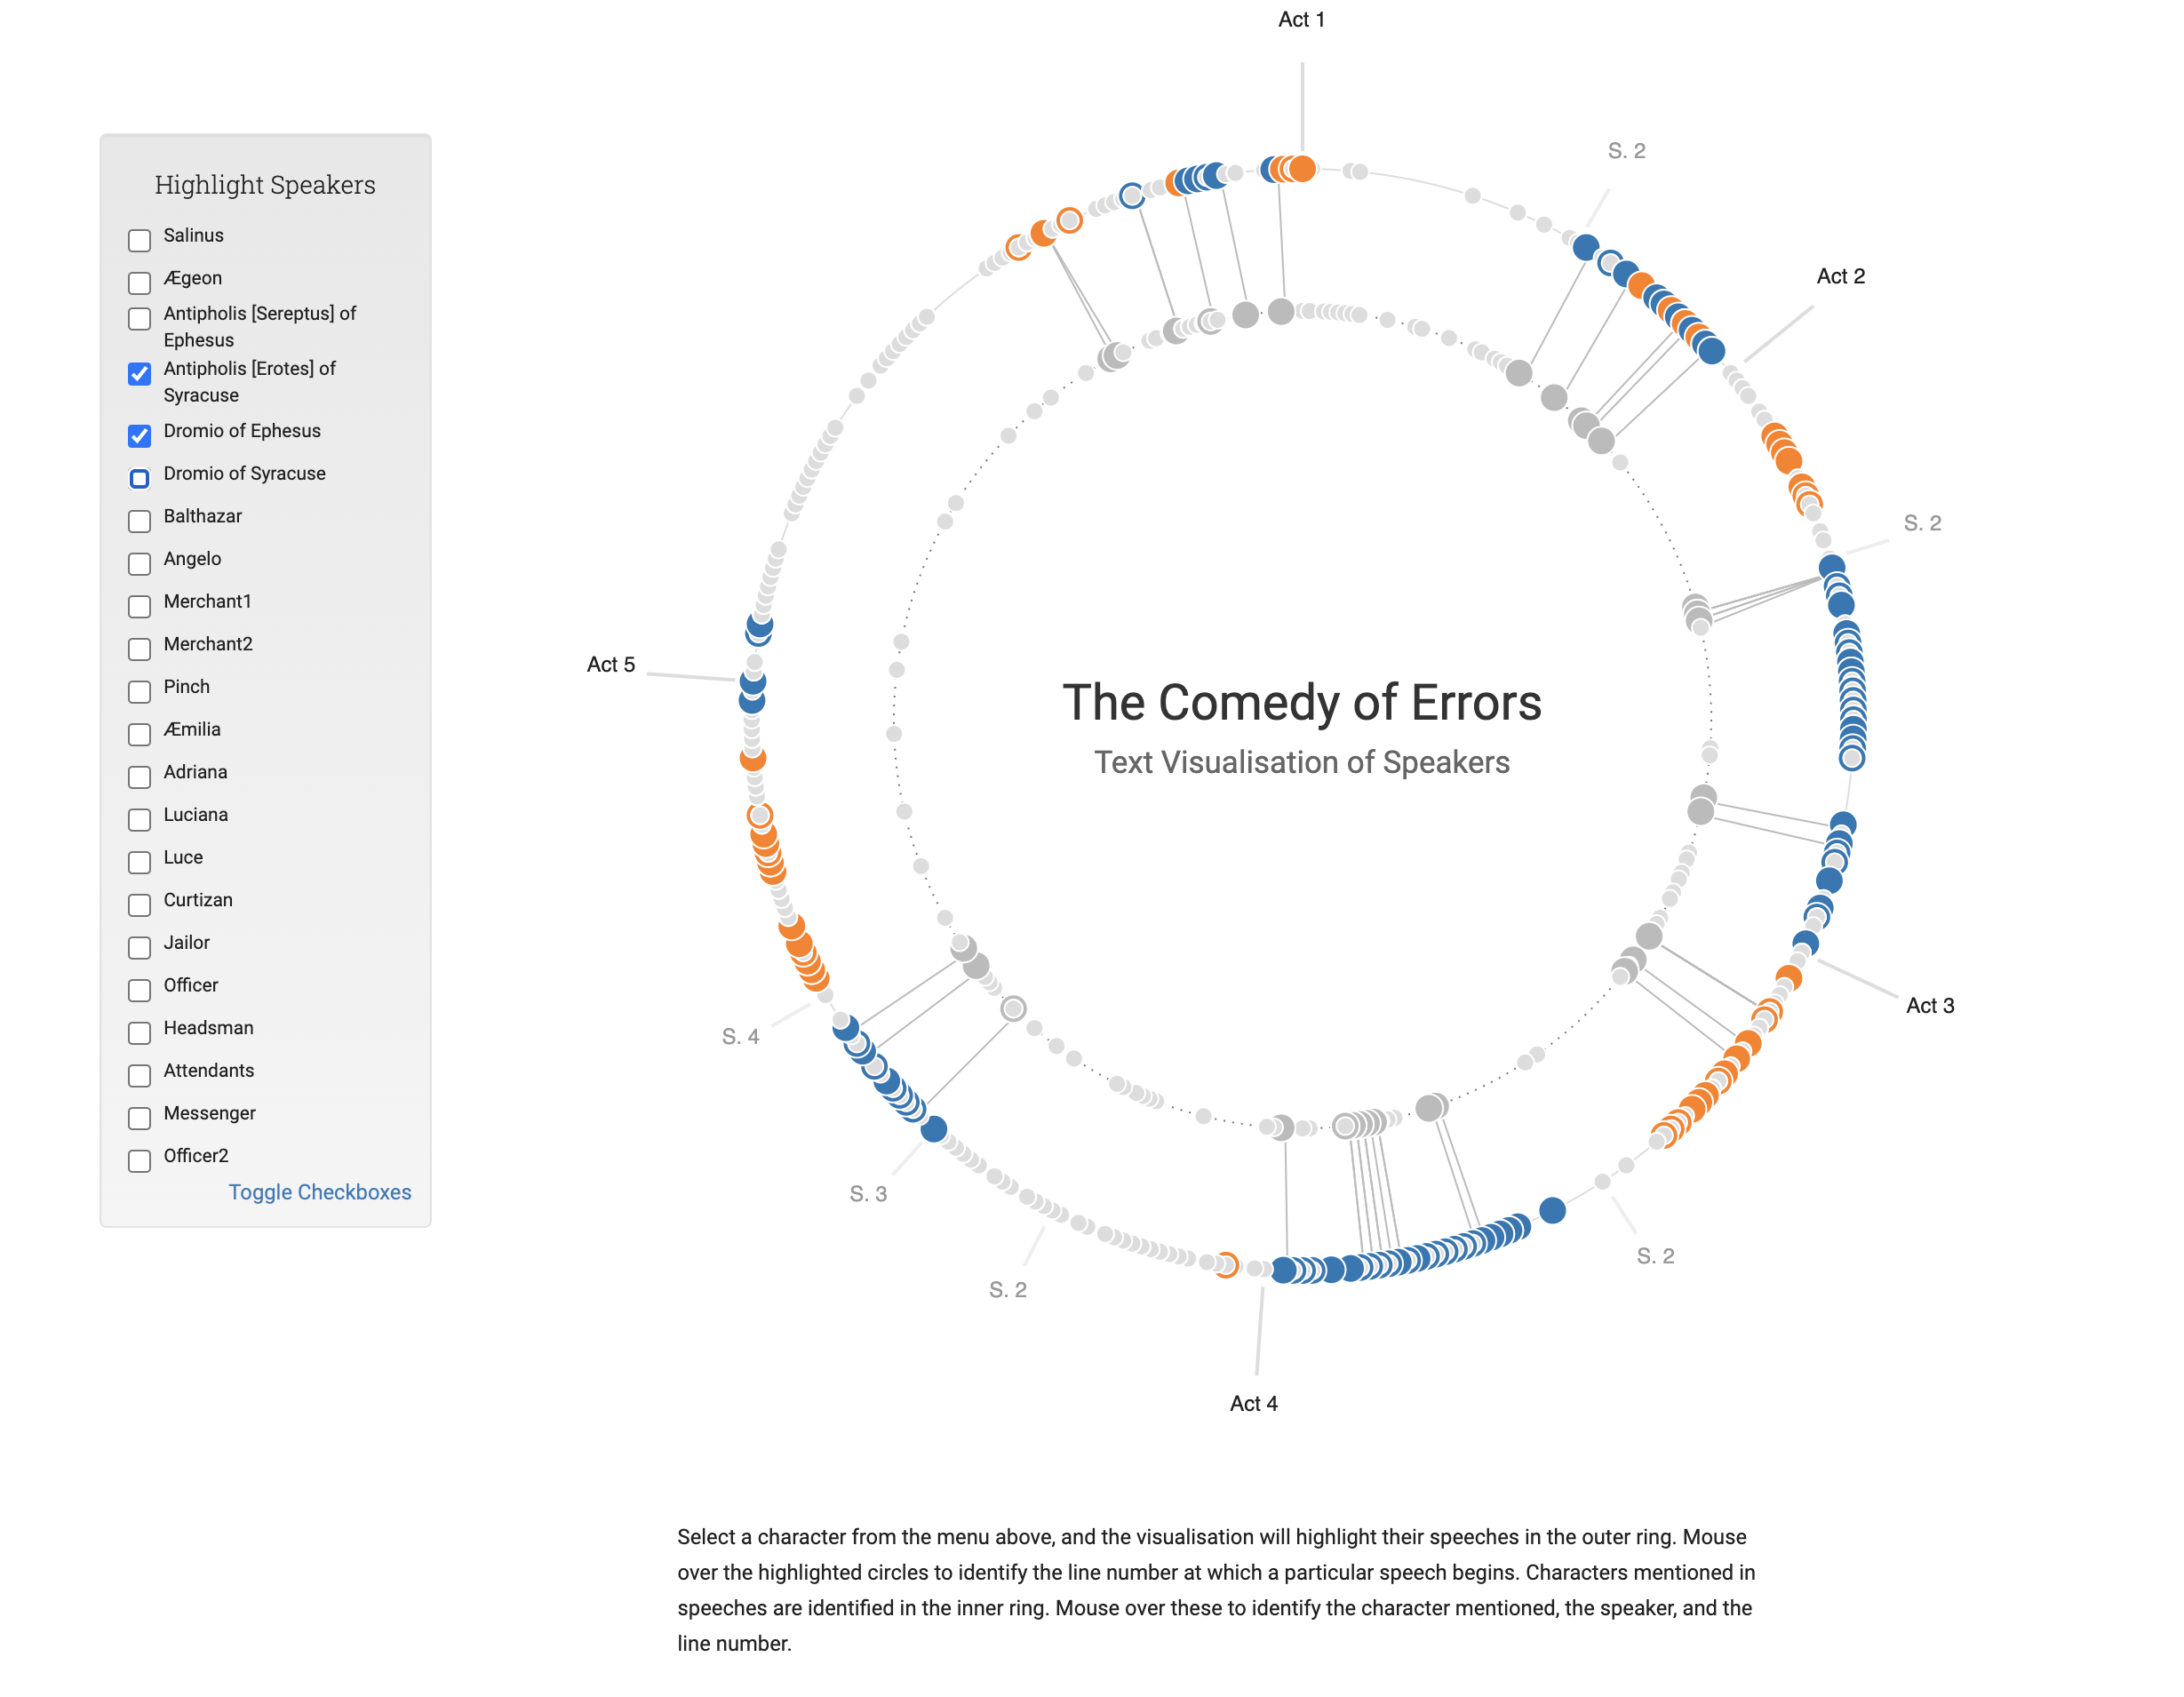
With colleagues in English, we developed Personæ, an interactive tool to examine the structure of dramatic texts by visualising who speaks, when, and to whom. This work was created using the texts of two of Shakespeare’s plays. Visualising the frequency, extent, and position of dialogue relating to a particular character presents users with a simple and immediate measure of that character’s prominence within the play. The tool enables users to select and visualise individual characters’ involvement, producing a novel means of exploring large-scale structural, narrative, or character-focused patterns within the text.

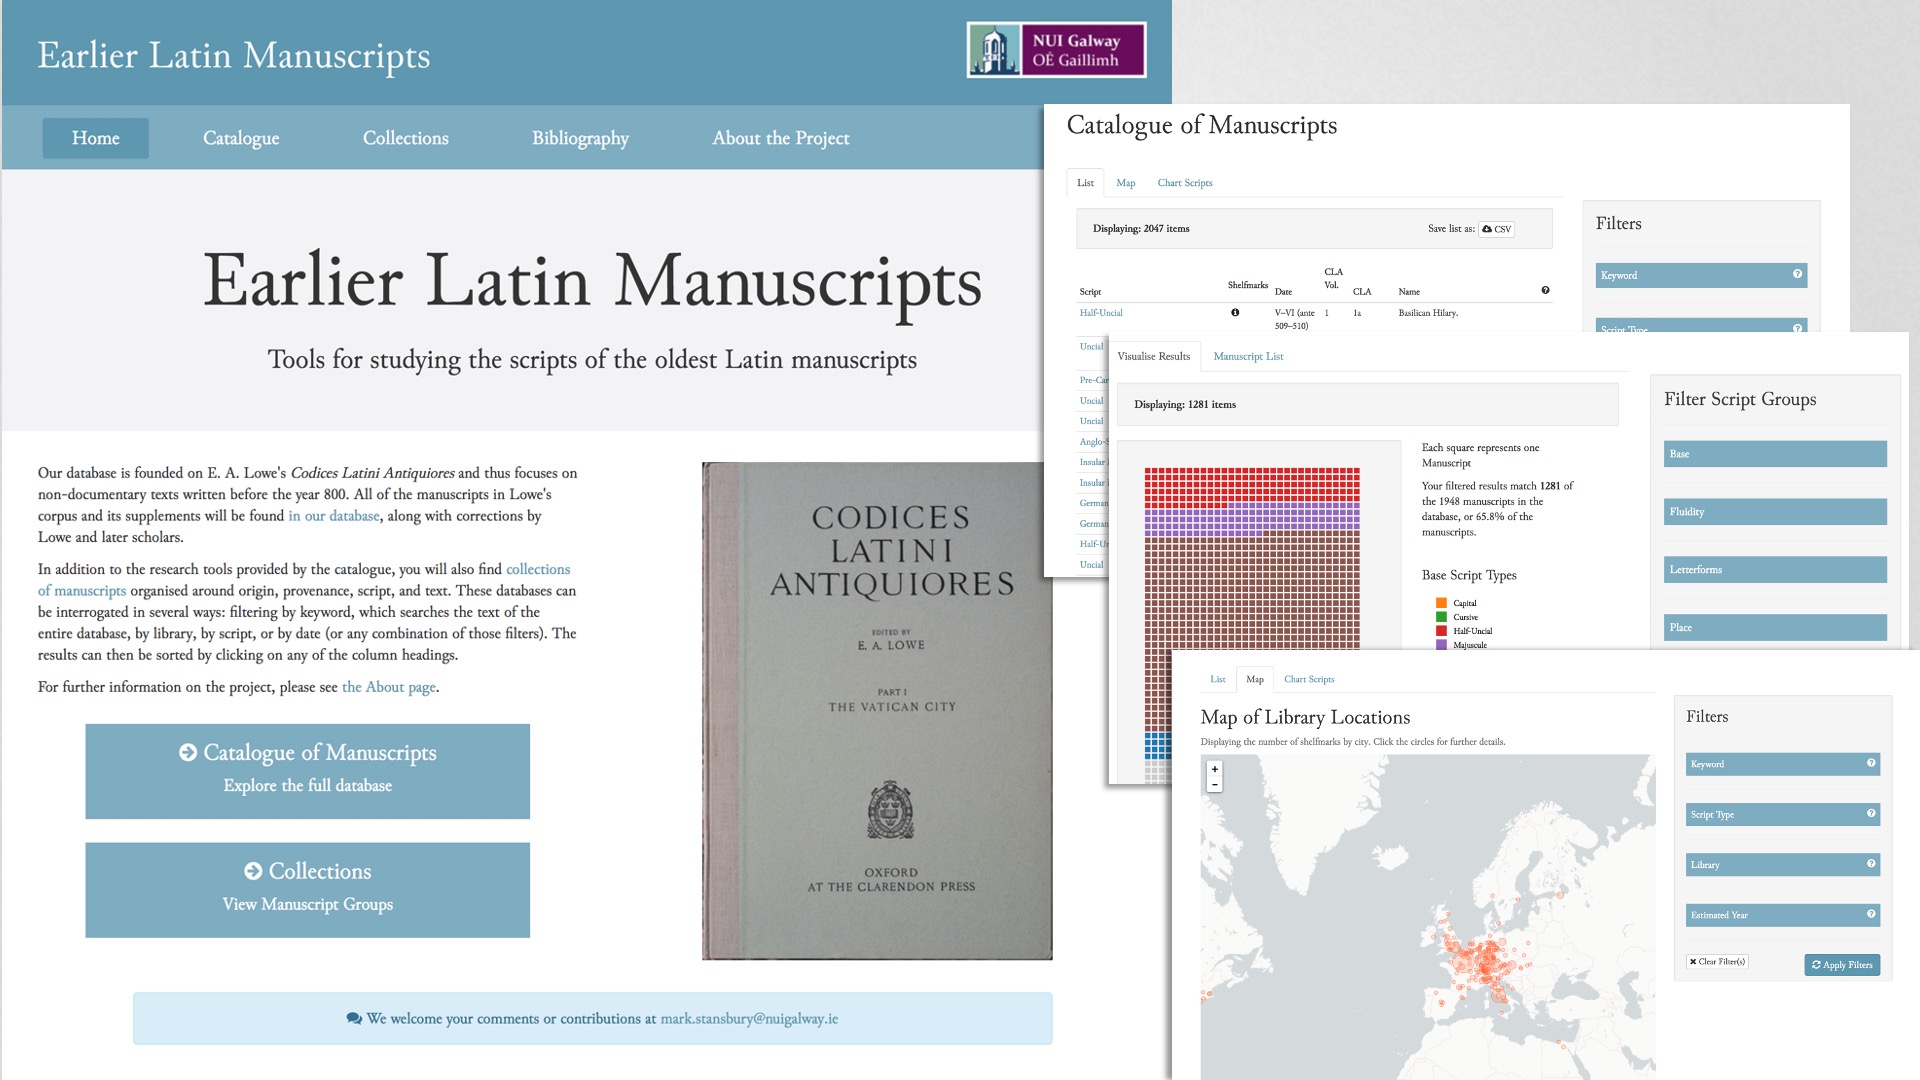
ELMSS: Tools for studying the oldest Latin manuscripts <https://elmss.nuigalway.ie>
With researchers from Classics, we have incorporated interactive visualisation into projects which brings new insights to resources which had previously only been available in print form, such as in the Earlier Latin Manuscripts project. In the Irish Research Council-funded Laureate project, Ireland and Carolingian Brittany: Texts and Transmission (IrCaBriTT), led by Dr Jacopo Bisagni, the resource “A Descriptive Handlist of Breton Manuscripts, c. AD 780–1100”, uses interactive data visualisation to enable researchers to explore a newly created collection of manuscripts in innovative and creative ways, such as by examining interactive maps of manuscript locations, and date-based charts.
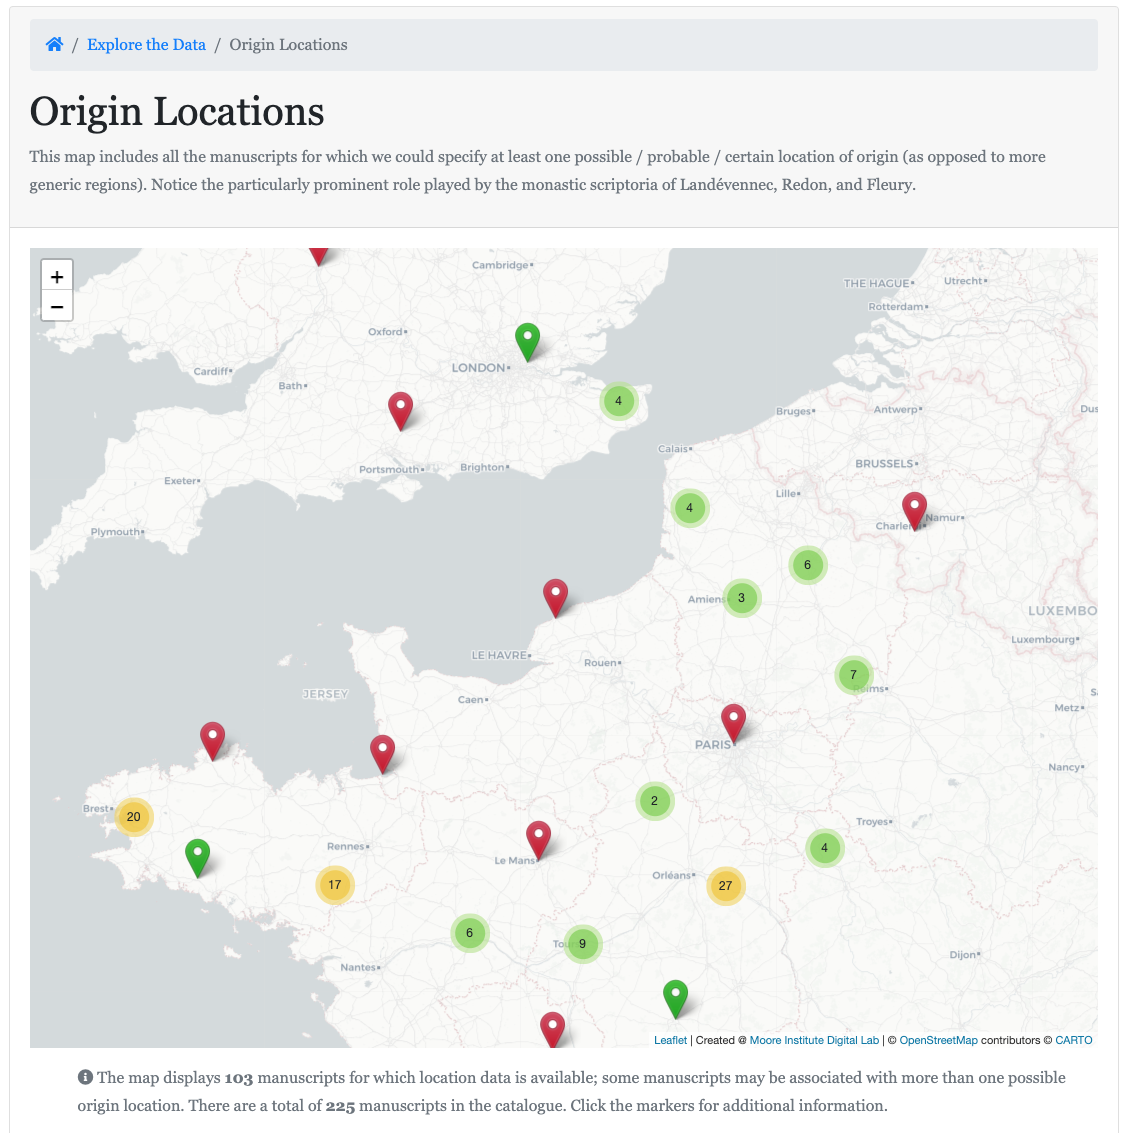
DHBM: Mapping manuscript origins –<http://ircabritt.nuigalway.ie/handlist/visualisation/origin-map>
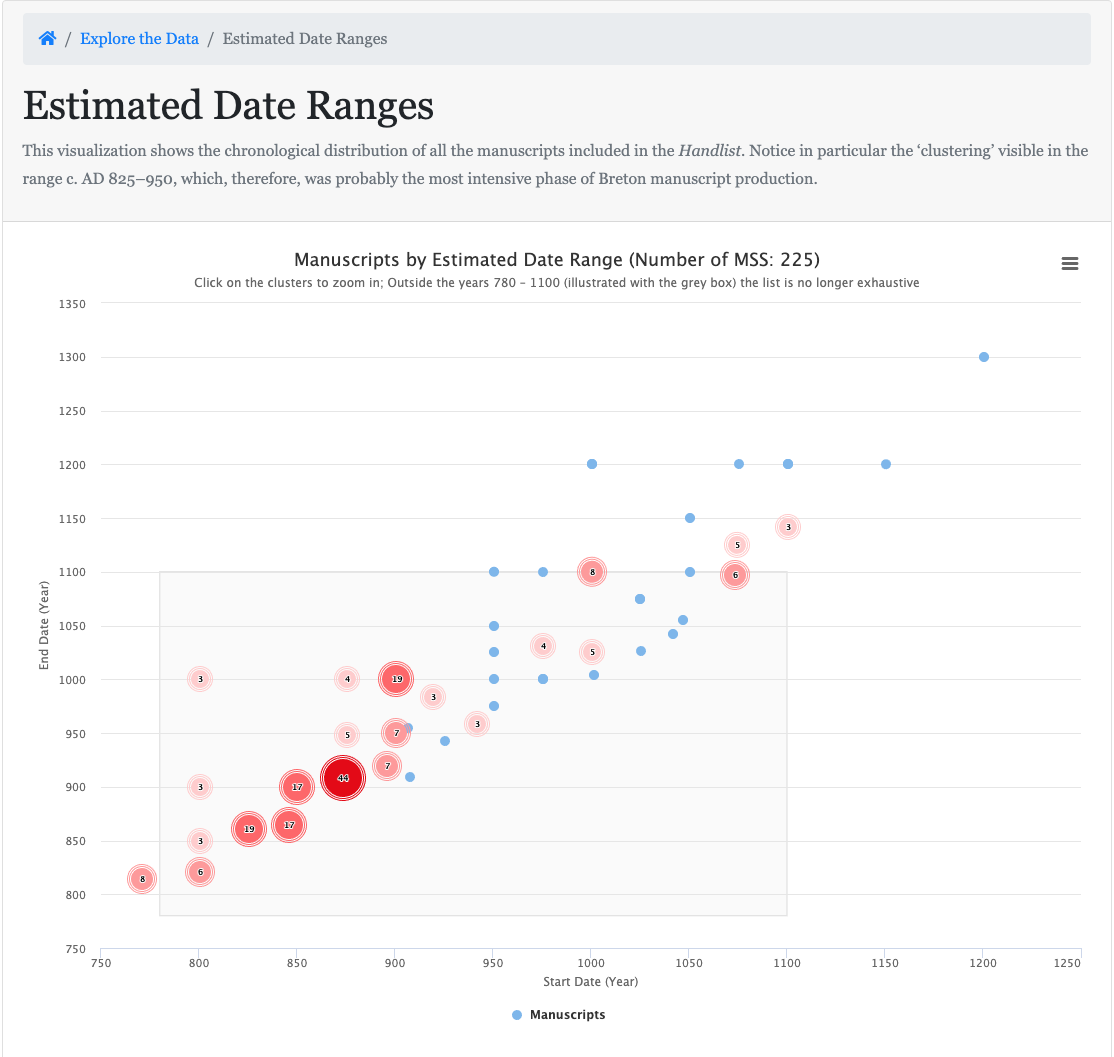
DHBM: Exploring Date Ranges <http://ircabritt.nuigalway.ie/handlist/visualisation/date-range>
One form of visualisation created by the project can be seen in the animation above, which shows the connections discovered between women writers and those who read their works, with special attention being drawn to significant figures in the period.
The Irish Research Council Laureate project, Republic of Conscience, led by Prof Rióna Ni Fhrighil, examines Irish poets’ literary responses to international human rights crises and violations from 1914 to the present. The project is currently exploring approaches to interactive visualisation which will give users of the web resource opportunities to engage with a collection of poetry which spans over 100 years. Users will view and explore the entire collection, or filter it by particular themes or world events, depending on their interests. Doing so will enable users to see patterns in the collection which may otherwise be missed, and to consider questions they may not otherwise identify
With colleagues in English, we developed Personæ, an interactive tool to examine the structure of dramatic texts by visualising who speaks, when, and to whom. This work was created using the texts of two of Shakespeare’s plays. Visualising the frequency, extent, and position of dialogue relating to a particular character presents users with a simple and immediate measure of that character’s prominence within the play. The tool enables users to select and visualise individual characters’ involvement, producing a novel means of exploring large-scale structural, narrative, or character-focused patterns within the text.

With researchers from Classics, we have incorporated interactive visualisation into projects which brings new insights to resources which had previously only been available in print form, such as in the Earlier Latin Manuscripts project. In the Irish Research Council-funded Laureate project, Ireland and Carolingian Brittany: Texts and Transmission (IrCaBriTT), led by Dr Jacopo Bisagni, the resource “A Descriptive Handlist of Breton Manuscripts, c. AD 780–1100”, uses interactive data visualisation to enable researchers to explore a newly created collection of manuscripts in innovative and creative ways, such as by examining interactive maps of manuscript locations, and date-based charts.

Developing data visualisation literacy
From a teaching and learning perspective, how might we help students to develop their data literacy? An understanding of the role of data visualisation relies on students thinking critically about what is being presented to them. This can include questioning the appropriateness of the presentation approaches being used, considering alternative approaches for the representation of the data shown (and what is not shown), and examining biases that may misrepresent what is shown in a visualisation. Such approaches not only help students to develop an understanding of the subject-specific data being presented but also creates valuable transferable skills that can be used in the workplace, and when encountering visual representations of data in day-to-day life.
Within the arts and humanities, there is already a significant body of completed European research projects that have utilised digital methods. Such projects often use data visualisation to communicate their findings and offer ready-made resources to draw on in the classroom. Similarly, there is a growing body of work from the data visualisation practitioner community that explores the topic of data literacy and its impact on the creation of data visualisations.
Moore Institute Digital Lab
Further details about the work of the Moore Institute’s Digital Lab, and details on connecting with us about a research project collaboration are available online at mooreinstitute.ie/digital-lab
Profiles
David Kelly is Digital Humanities Manager at the Moore Institute, NUI Galway. He works with researchers from the Arts & Humanities on the design and development of innovative and creative digital projects that both enable and better communicate their research.

